Institutional VWAP Suite
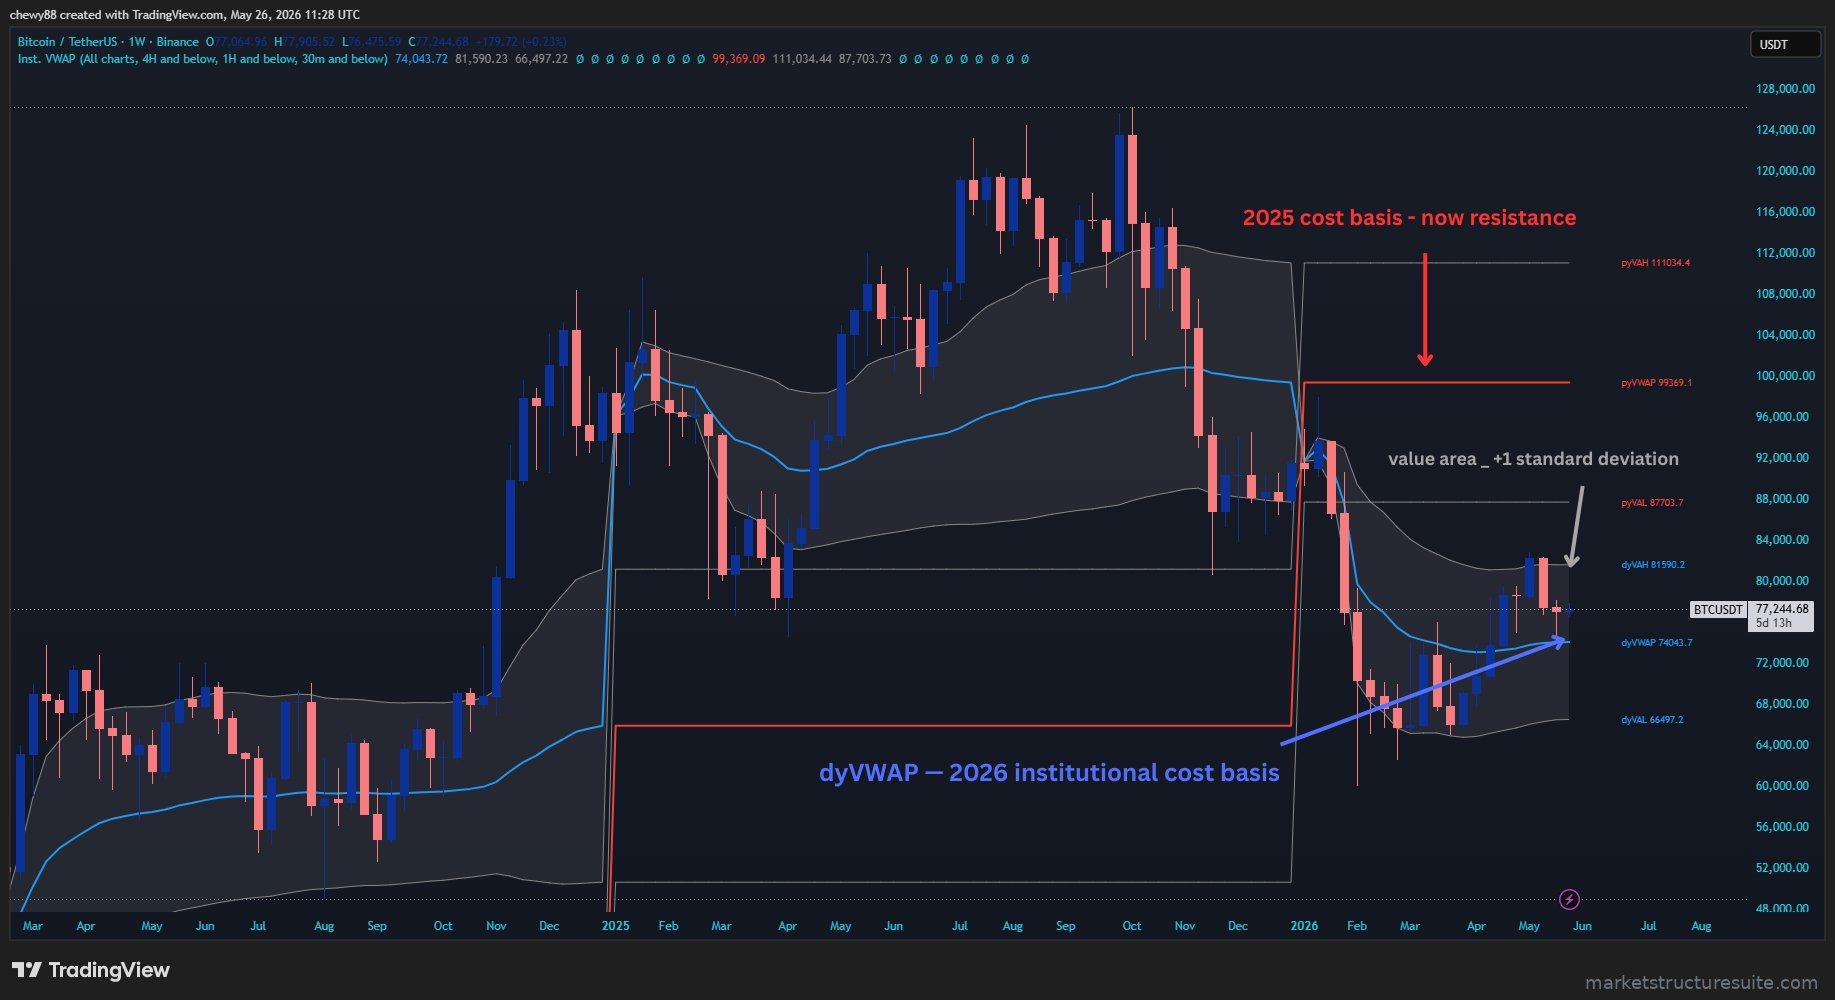
Yearly and monthly anchored VWAP levels with value areas. The developing yearly VWAP (dyVWAP) is the single most important level on any chart — the Global Line in the Sand. Price above it means bullish institutional bias. Below means bearish.
Developing yearly VWAP (dyVWAP) — your global bias reference
Previous yearly VWAP (pyVWAP) — major historical support and resistance
Developing and previous yearly value areas (VAH/VAL)
Developing and previous monthly VWAP levels
Auto timeframe mode — shows relevant levels for your chart automatically
Anchored labels on right edge — always visible, never floating on scroll
Manual override — toggle any period independently
Smart Money Range
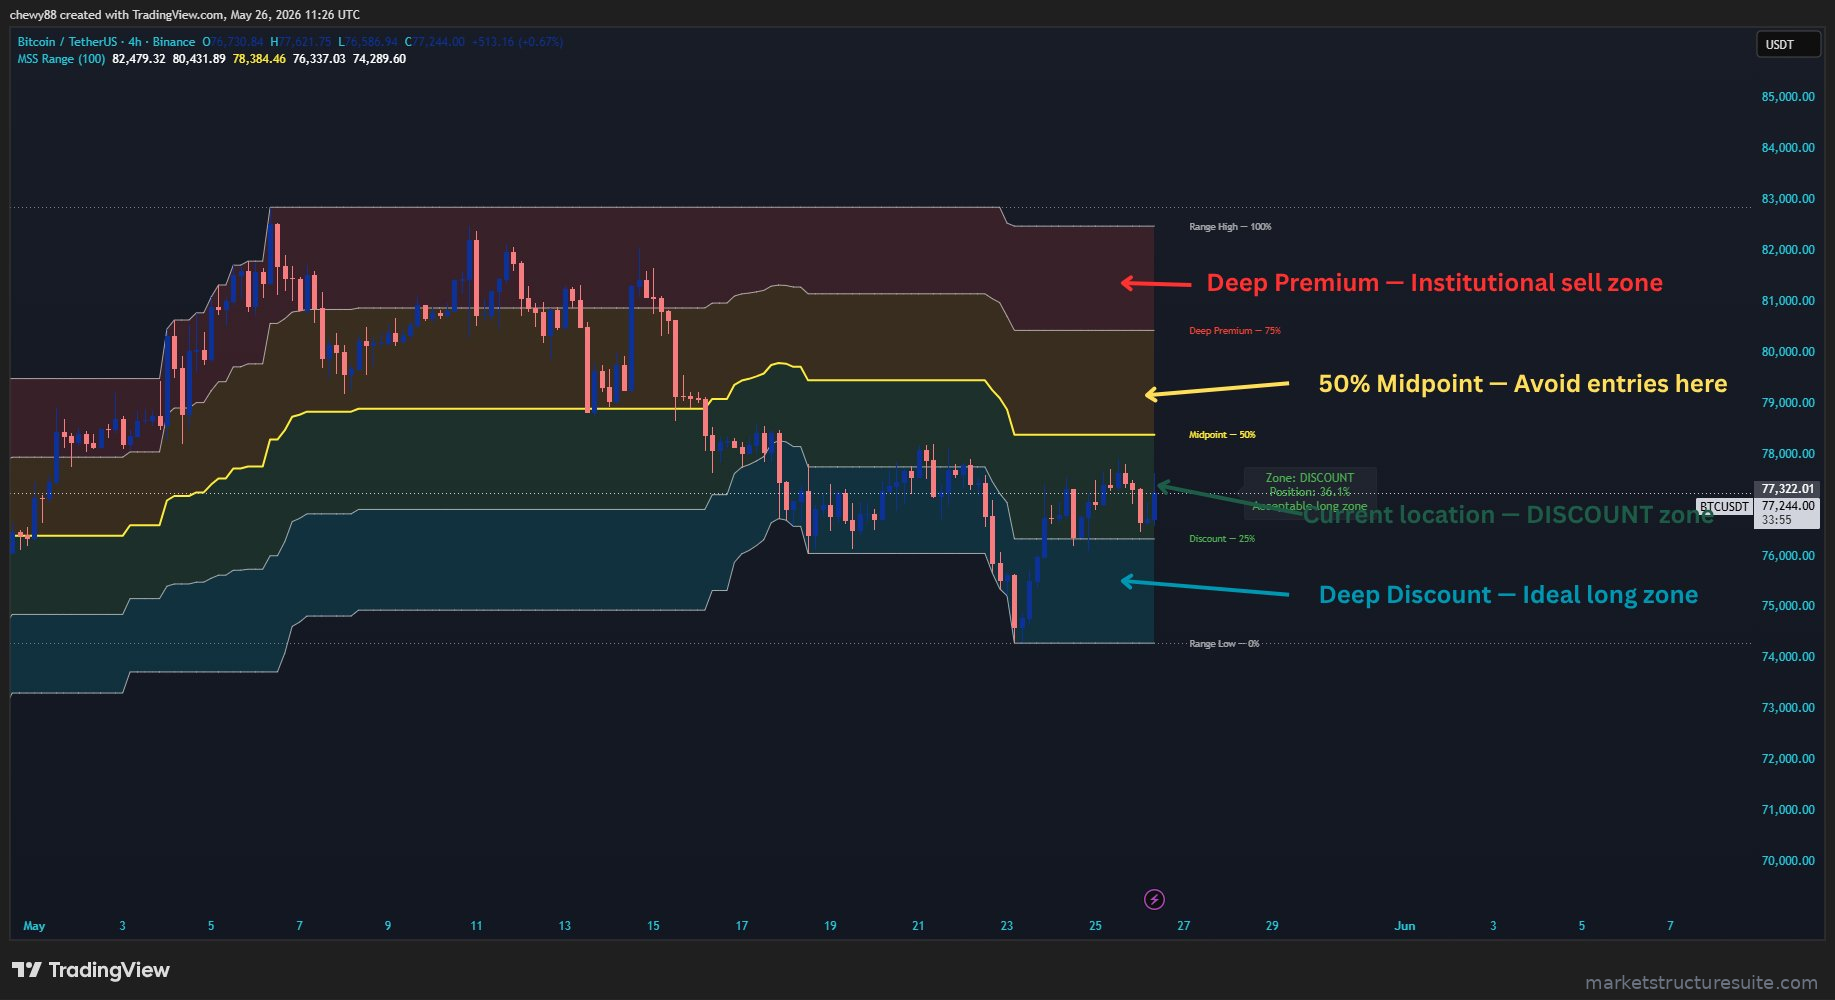
The most common reason retail traders lose money is buying in premium and selling in discount — the exact opposite of what institutions do. The Smart Money Range shows you exactly where you are in the current structure so you only trade in zones where the edge exists.
Five colour-coded zones — Deep Discount, Discount, Midpoint, Premium, Deep Premium
100-candle lookback (adjustable) — approximately 17 days on 4H
Real-time location label showing current zone and position percentage
25%, 50% and 75% levels clearly marked
Zone fills for instant visual recognition
Institutional OB Scanner
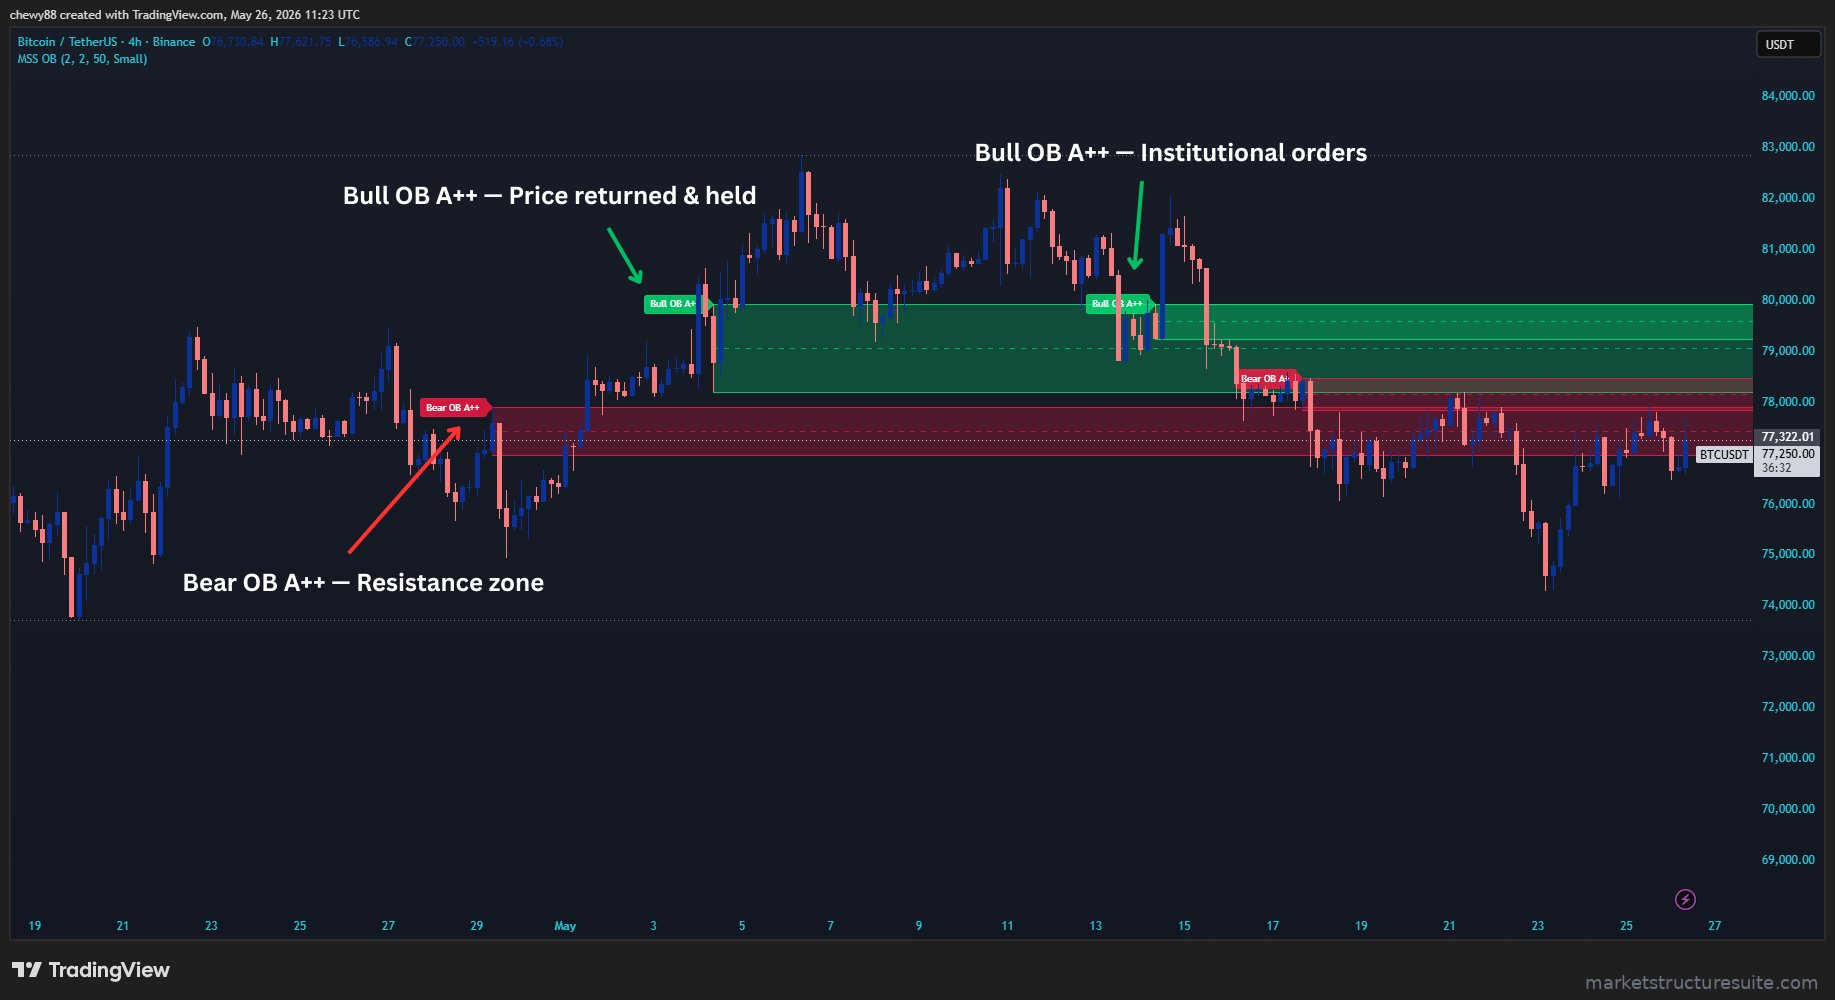
Order blocks are where institutions placed their orders. When price returns to these zones those orders are still active — providing real support and resistance, not arbitrary lines. The OB Scanner finds them automatically and grades their quality so you always know the conviction behind the level.
Automatic bullish and bearish order block detection on confirmed closes
Three-tier grading — A++ (highest conviction), A+ and A
Adjustable lookback and max OBs displayed
50% midline on every OB — key retest level
No repainting — all calculations on confirmed bar closes
Smart Money FVG Scanner
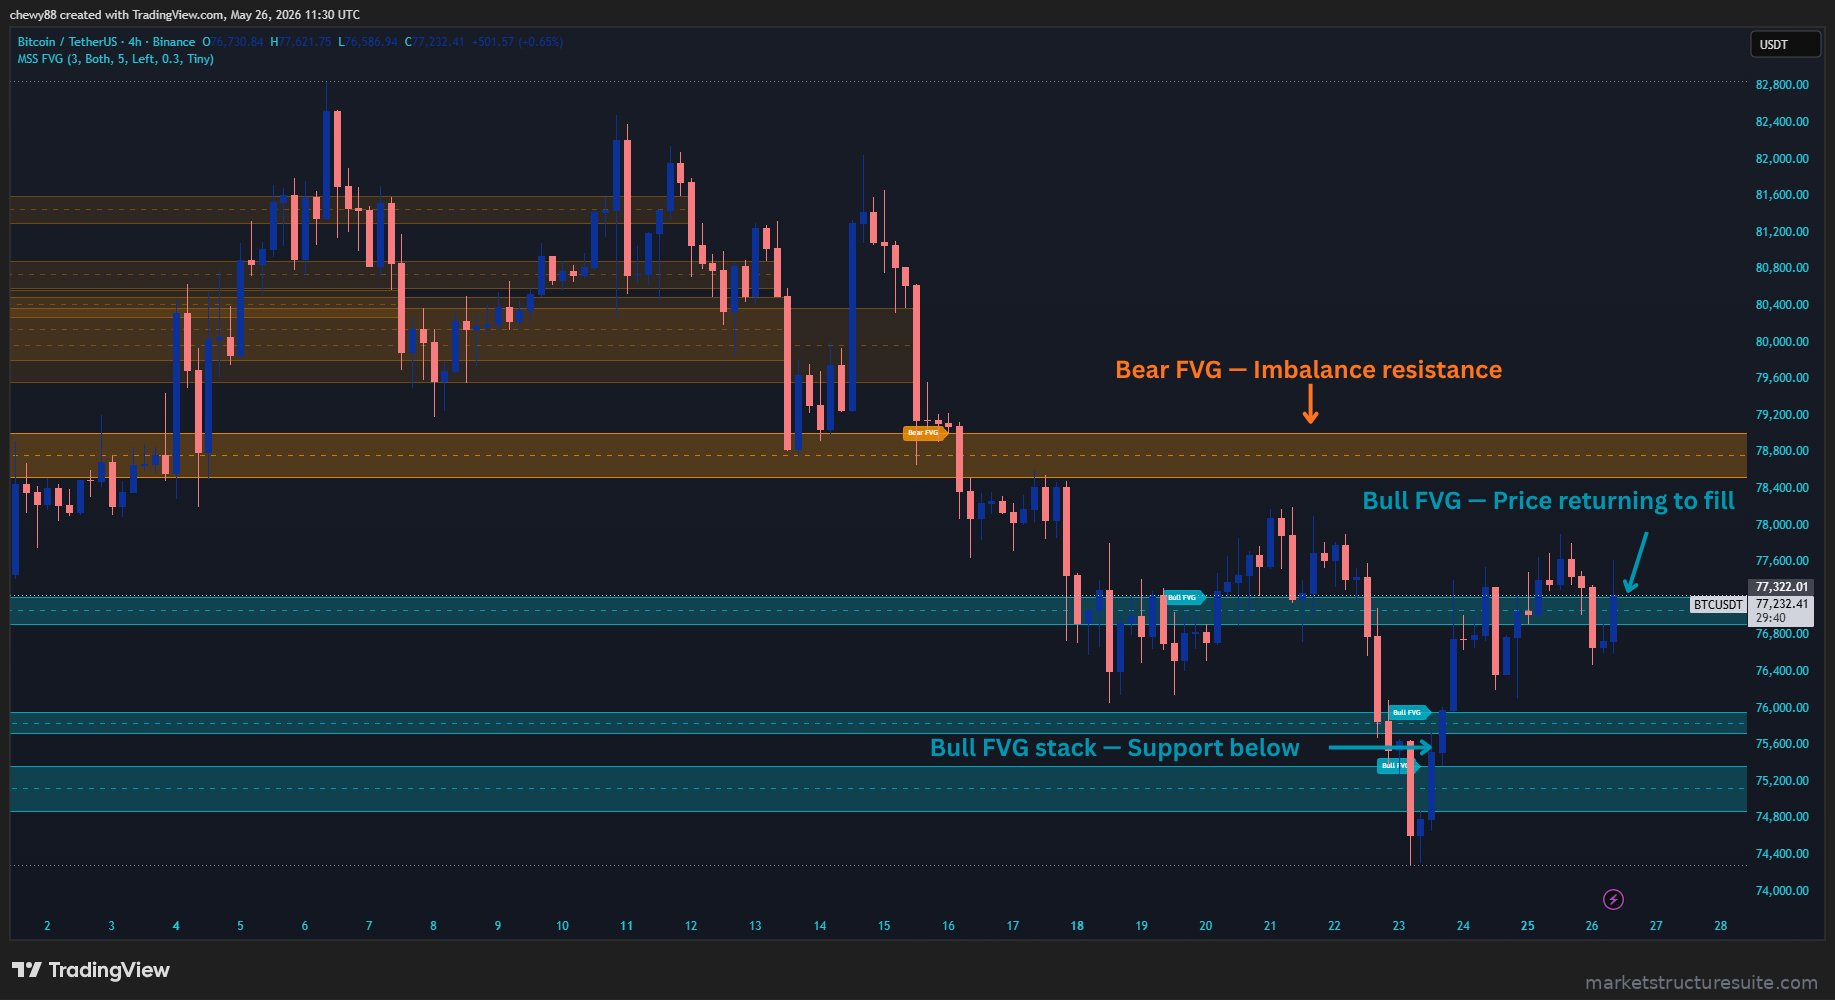
Fair value gaps are price inefficiencies institutions leave behind when they move markets aggressively. These gaps act as magnets — price almost always returns to fill them. The FVG Scanner finds them automatically and highlights the rare Unicorn setup when a gap forms at a swing extreme.
Automatic bullish and bearish FVG detection with minimum gap size filter
Clean impulse candle filter — only marks FVGs with genuine directional momentum
50% midline on every FVG — the critical retest level within the gap
Unicorn detection (purple) — FVG at swing extreme, highest conviction setup
Automatic mitigation — gaps disappear when price fully closes through them
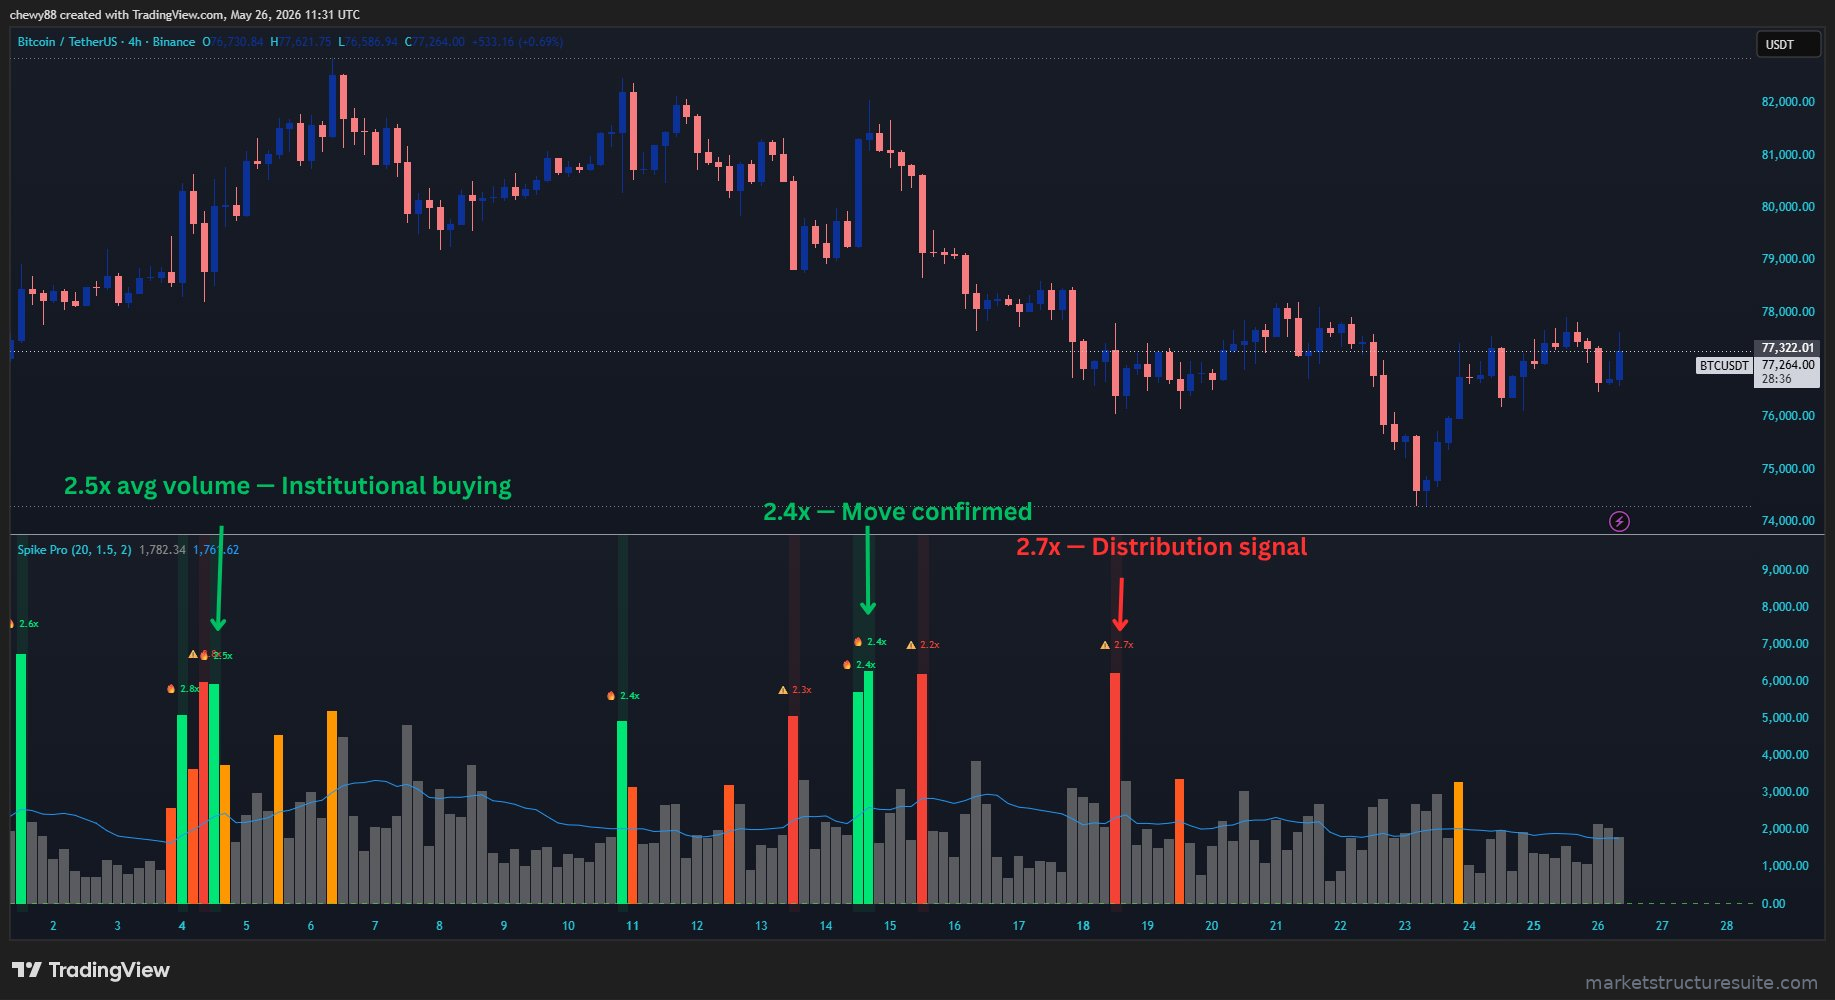
Spike Detector Pro
Price without volume is incomplete information. The Spike Detector Pro identifies when volume is significantly above its moving average — the signature of institutional participation. A bright green spike as price enters a discount OB is the difference between a guess and a confirmed entry.
Colour-coded bars — grey (normal), orange (elevated), green (bull spike), red (bear spike)
20-period volume moving average baseline
Spike ratio labels above each bar — shows exact multiple (e.g. 2.4x)
Configurable thresholds — elevated and high conviction levels
Three built-in alert conditions — bull spike, bear spike, elevated volume
Get the Full Suite
All five indicators working together — the complete institutional analysis toolkit for TradingView.